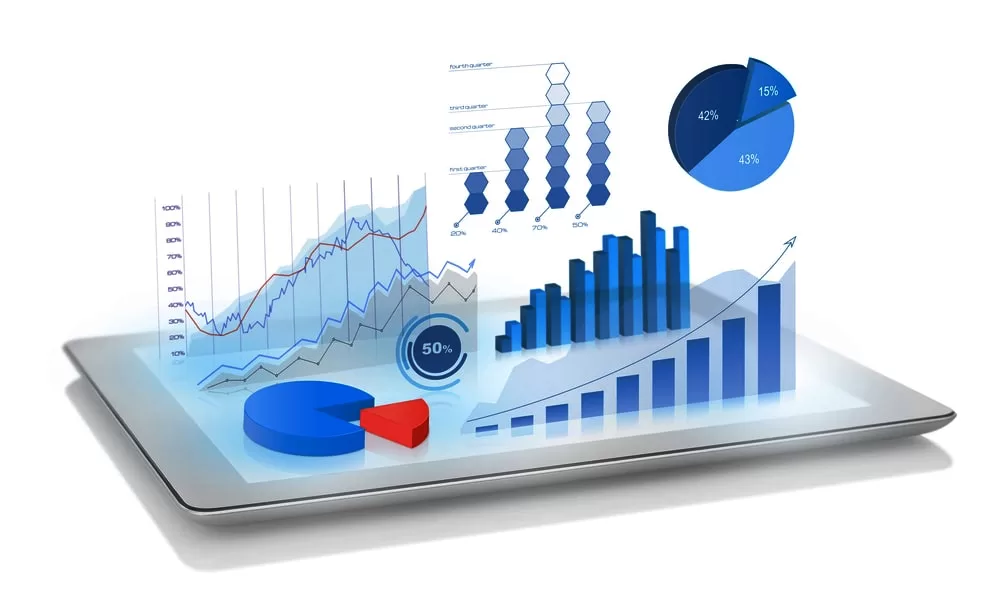
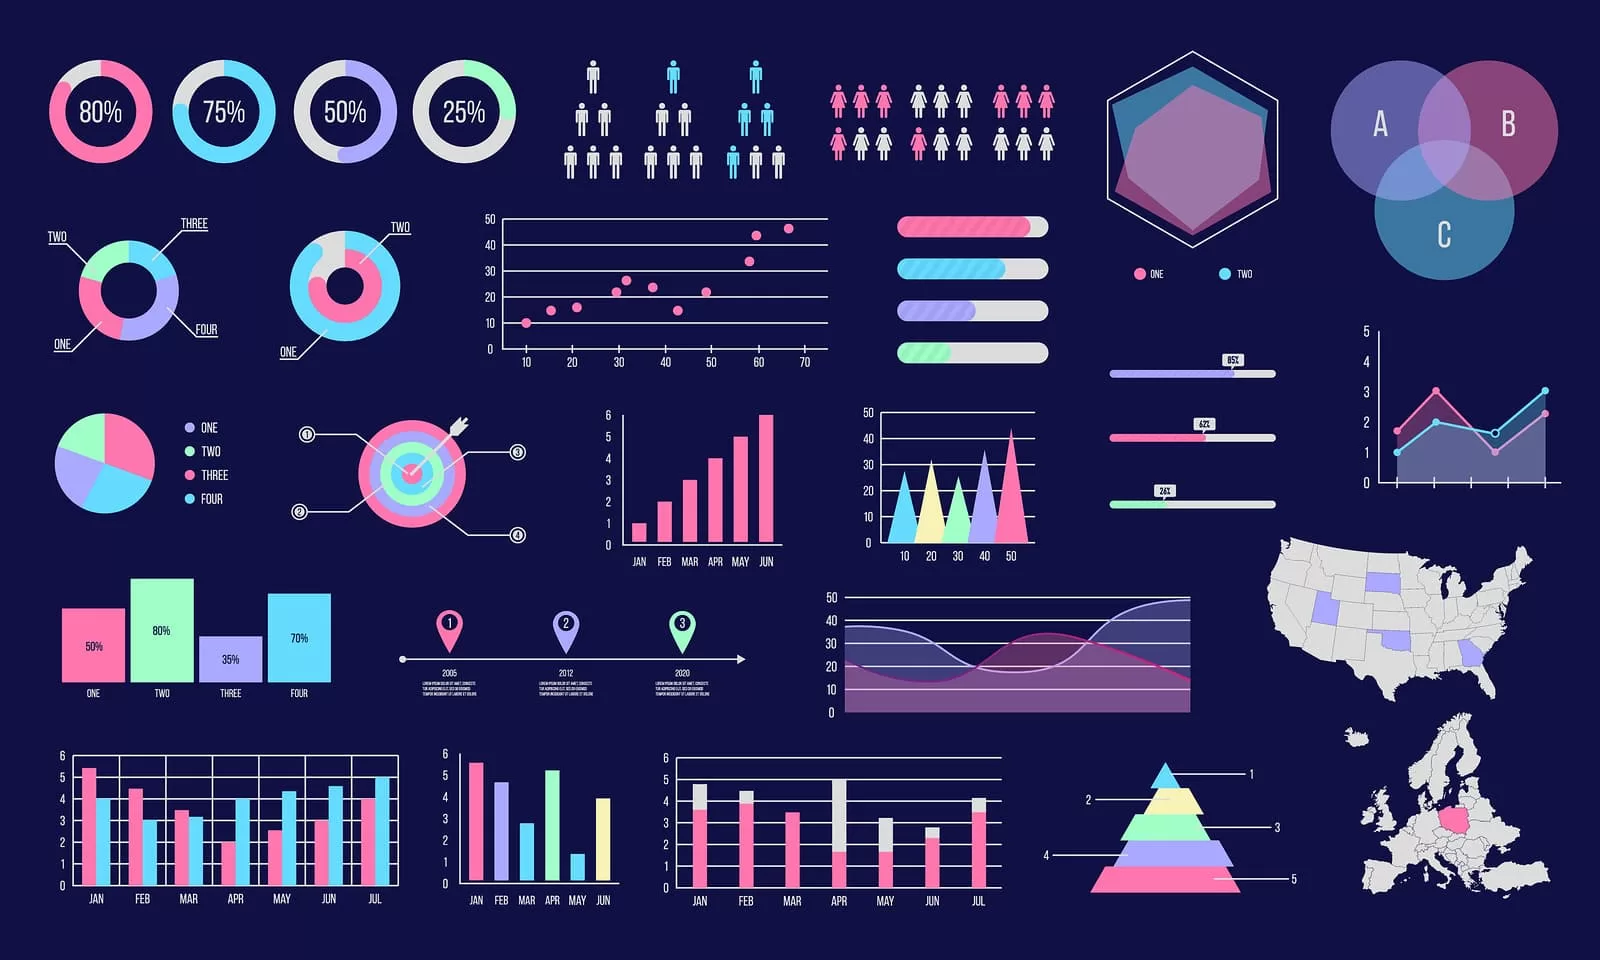
The ability to effectively communicate information through visuals has become increasingly crucial. Data visualization is the practice of representing complex data sets in a visual format, such as charts, graphs, and maps. This article explores the importance of data visualization, the individuals and industries that benefit from it, the techniques employed, and the tools commonly used. Let’s delve into the captivating realm of data visualization.
Why is Data Visualization Important?

Data visualization plays a pivotal role in transforming raw data into meaningful insights. Here are some key reasons why it holds immense importance:
Enhanced Clarity: Visual representations simplify complex information, making it easier to grasp patterns, trends, and correlations within the data.
Improved Decision-Making: Clear and concise visuals aid in making informed decisions by presenting data in a manner that is visually appealing and easy to interpret.
Efficient Communication: Data visualization enables effective communication of insights to diverse audiences, facilitating better understanding and engagement.
Who Uses Data Visualization?
Data visualization finds application across various domains and professions, including:
Business Analysts: Visualizations help analysts uncover meaningful insights, identify opportunities, and drive informed business decisions.
Researchers and Scientists: Data visualization aids researchers and scientists in presenting their findings, facilitating comprehension and knowledge sharing.
Marketing Professionals: Visualizations assist marketers in understanding customer behavior, analyzing campaign performance, and optimizing strategies.
clslearn offers you the best courses in the course of Microsoft Azure Data Fundamentals
Which Data Visualization Techniques Are Used?
Several techniques are employed to present data visually, including:
Charts and Graphs: Bar charts, line graphs, pie charts, and scatter plots are commonly used to represent numerical data in a visually appealing manner.
Maps and Geospatial Visualizations: These techniques leverage geographical data to visualize patterns, demographics, and spatial relationships.
Infographics: Combining data, text, and visuals, infographics provide a concise and engaging overview of complex information.
Data Visualization Tools:

To create impactful visualizations, numerous tools are available, offering a wide range of features and capabilities. Some popular data visualization tools include:
Tableau: A versatile tool that enables users to create interactive and dynamic visualizations with ease.
Power BI: Microsoft’s powerful business intelligence tool that allows users to create visually stunning reports and dashboards.
D3.js: A JavaScript library for producing custom, interactive, and data-driven visualizations on the web.
QlikView: A business intelligence and data visualization tool that allows users to create interactive dashboards and reports.
Google Data Studio: A free and cloud-based tool that enables users to create customizable and shareable visualizations using data from various sources.
Plotly: A web-based data visualization library that offers a wide range of interactive charts, graphs, and maps for creating visually appealing presentations.
IBM Watson Analytics: An advanced analytics platform that provides data exploration, predictive analytics, and data visualization capabilities.
SAS Visual Analytics: A comprehensive tool that allows users to explore data, create interactive reports, and generate visually compelling dashboards.
Chart.js: A lightweight JavaScript library that simplifies the process of creating and embedding responsive charts and graphs into web applications.
Apache Superset: An open-source data exploration and visualization platform that offers a rich set of visualizations and interactive dashboards.
clslearn offers you the best courses in the course of Microsoft Azure Administrator
Examples of Data Visualization:
Data visualization can be seen in various contexts, showcasing its versatility and applicability. Here are a few examples:
Sales Performance Dashboard: Visualizing sales data through interactive dashboards, providing real-time insights into revenue, customer trends, and regional performance.
Weather Patterns: Utilizing maps and color-coded visualizations to showcase weather patterns and climate changes across different regions.
Social Media Analytics: Visualizing social media metrics, such as engagement, reach, and sentiment analysis, to gain actionable insights for marketing campaigns.
Common Data Visualization Use Cases:
Data visualization finds utility in numerous scenarios, including:
Financial Analysis: Visualizing financial data, such as revenue, expenses, and investment portfolios, to identify trends and make informed financial decisions.
Healthcare: Visualizing patient data, medical records, and disease patterns to improve diagnostics, treatment, and public health initiatives.
Supply Chain Management: Utilizing visualizations to optimize inventory levels, track shipments, and identify bottlenecks for efficient supply chain operations.
Get to know about: POWER BI VS EXCEL: DECIDING BETWEEN THE TWO
Examples of industries and use cases where data visualization tools are commonly used:

Finance and Banking: Data visualization tools are extensively used in the finance and banking industry for tasks such as financial reporting, risk analysis, portfolio management, and fraud detection. These tools help professionals visualize and analyze large volumes of financial data, enabling them to make informed decisions and identify patterns or anomalies.
Marketing and Advertising: Data visualization tools play a crucial role in marketing and advertising by helping professionals analyze campaign performance, track customer behavior, and identify target audiences. Visualizations aid in understanding customer demographics, engagement metrics, conversion rates, and sentiment analysis, allowing marketers to optimize their strategies and maximize ROI.
Healthcare and Life Sciences: In the healthcare industry, data visualization tools assist in visualizing patient data, medical records, and clinical trials. They enable healthcare professionals to analyze trends, identify patterns, and make data-driven decisions for better patient care, disease prevention, and public health initiatives.
Retail and E-commerce: Data visualization tools are utilized in retail and e-commerce industries to analyze sales data, inventory levels, customer buying behavior, and market trends. Visualizations help retailers identify popular products, optimize pricing strategies, and identify opportunities for cross-selling or upselling.
Manufacturing and Supply Chain: Data visualization tools are instrumental in optimizing manufacturing processes and supply chain operations. They allow professionals to visualize production data, track inventory levels, identify bottlenecks, and optimize resource allocation. Visualizations enable efficient decision-making and help streamline operations.
Energy and Utilities: In the energy and utilities sector, data visualization tools aid in monitoring energy consumption, analyzing meter readings, and identifying patterns in energy usage. Visualizations help utility companies optimize energy distribution, identify areas of high consumption, and implement energy-saving initiatives.
Data visualization serves as a powerful tool for transforming complex data into clear and compelling visual representations. Its importance lies in enhancing clarity, aiding decision-making, and facilitating effective communication. With an array of techniques and tools available, data visualization empowers various professionals and industries to derive meaningful insights and unlock the true potential of their data. Embrace the power of data visualization and embark on a journey of discovery, understanding, and informed decision-making.


