


ِIn today’s data-driven world, businesses rely on powerful tools to analyze and visualize data effectively. When it comes to data analysis and reporting, two popular options stand out: Microsoft Power BI and Microsoft Excel. Both tools offer unique capabilities and cater to different needs. This article provides a comprehensive head-to-head comparison of Power BI and Excel, highlighting their differences, similarities, and ultimately helping you decide which tool is best suited for your data analysis requirements.
Power BI vs Excel: Head-to-Head Comparison:
Power BI and Excel are both Microsoft products, but they serve different purposes when it comes to data analysis and reporting. Here’s a detailed comparison of the two tools:
- Functionality and Data Handling:
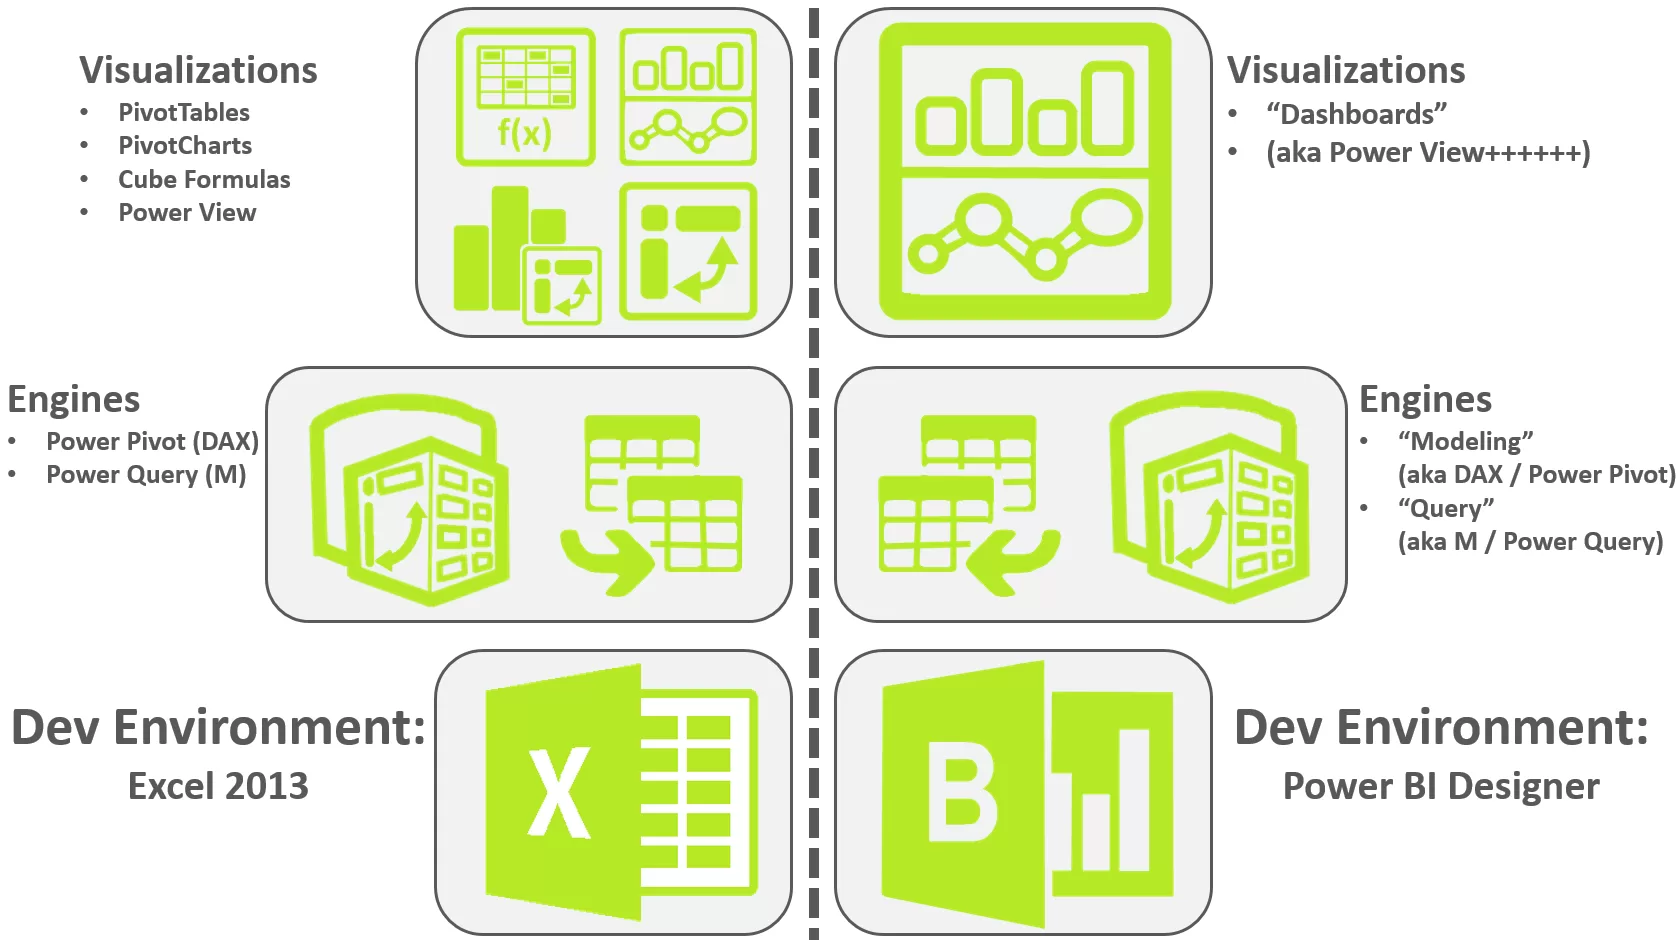
Excel is a versatile spreadsheet software that allows users to manipulate and analyze data using formulas, functions, and pivot tables. It provides a wide range of features for data organization, calculations, and basic visualizations. On the other hand, Power BI is a dedicated business intelligence tool that focuses on data modeling, interactive visualizations, and advanced analytics. It enables users to connect to various data sources, create complex data models, and build interactive dashboards and reports.
- Scalability and Performance:
Excel is suitable for small to medium-sized datasets and can handle basic data analysis tasks efficiently. However, as the dataset and complexity grow, Excel’s performance may start to decline. Power BI, designed for larger datasets and enterprise-level reporting, excels in handling big data and provides robust performance even with complex calculations and visualizations. It leverages in-memory technology and optimized data models to deliver faster and more scalable results.
- Collaboration and Sharing:
Excel allows for easy sharing of workbooks via email or cloud storage platforms like OneDrive. While multiple users can collaborate on a workbook simultaneously, it may lead to version control issues. Power BI, on the other hand, offers enhanced collaboration features. It enables users to create and share interactive dashboards and reports on the Power BI service, allowing real-time collaboration, data refresh, and access control. Power BI also provides the ability to publish reports to the web or embed them in other applications for broader sharing.
- Visualizations and Reporting:
Excel provides basic charting and graphing capabilities, allowing users to create static visuals. Power BI, however, offers a wide range of customizable and interactive visualizations, including charts, maps, and gauges. It enables users to create dynamic reports that respond to user interactions, drill down into data, and provide a rich visual experience. Power BI also provides advanced data exploration features like natural language queries and Q&A, making it easier to find insights quickly.
clslearn offers you the best courses in the course of Analyzing Data with Excelbusiness management
How They are Similar?
Despite their differences, Power BI and Excel share some common features and capabilities:
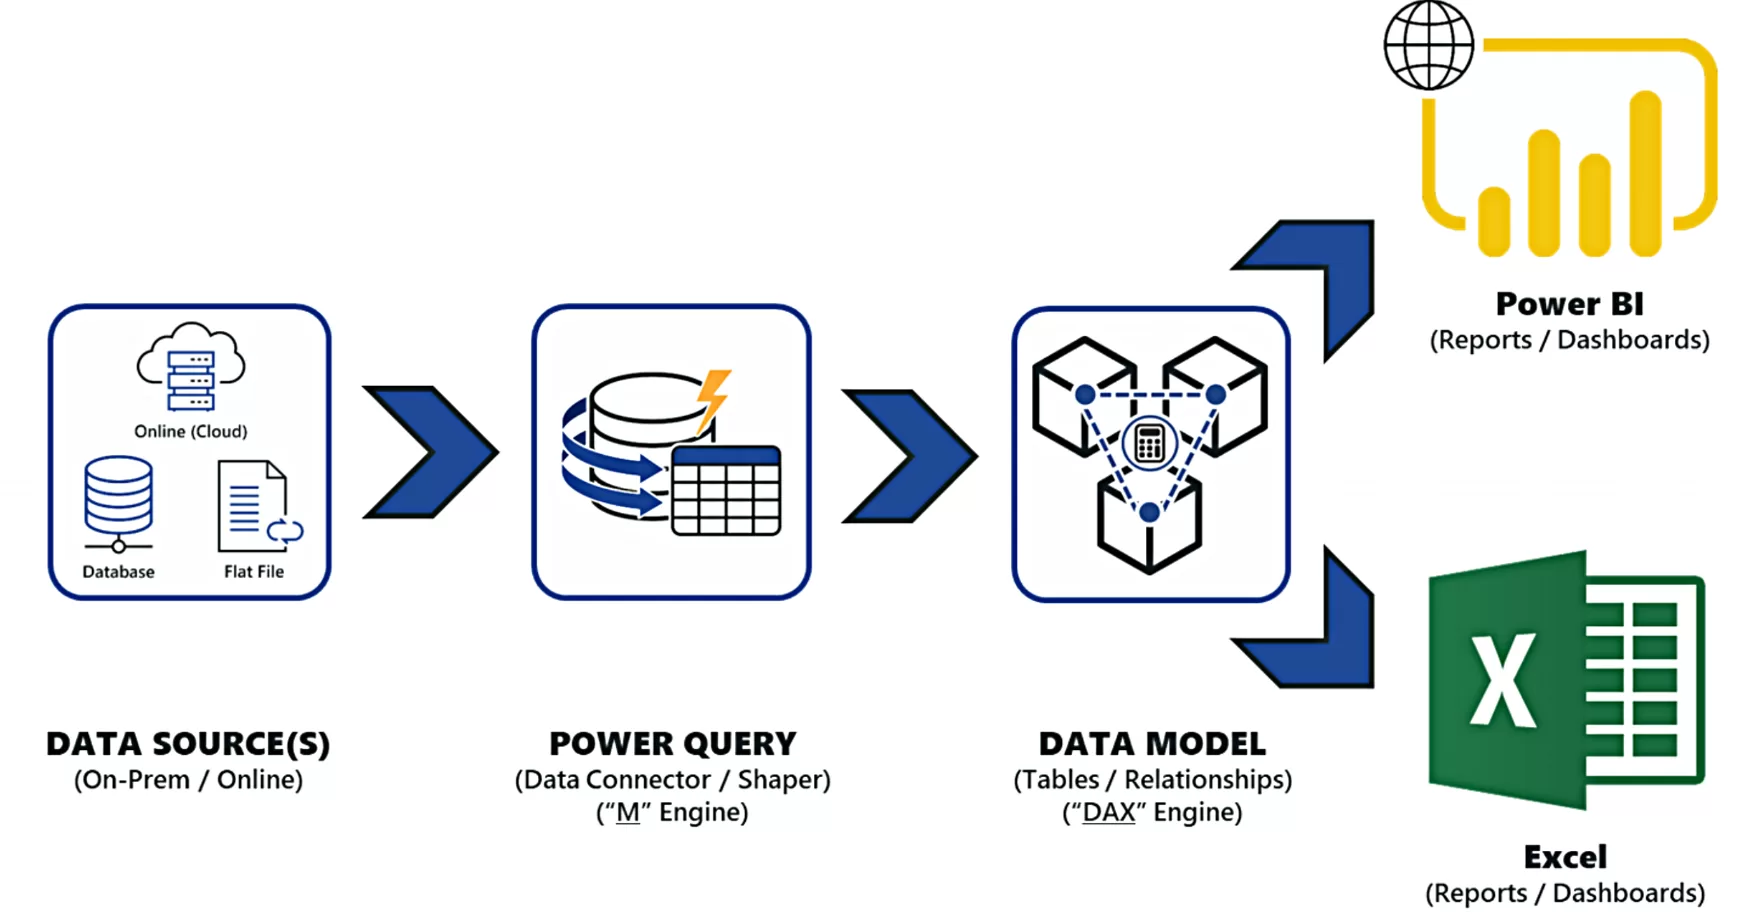
- Data Integration: Both tools allow users to connect to various data sources, including databases, spreadsheets, cloud services, and more.
- Data Transformation: Both Power BI and Excel provide options to clean, transform, and shape data using formulas, functions, and data manipulation tools.
- Calculation Engine: Excel’s formula engine is also available in Power BI, allowing users to perform calculations and create calculated columns and measures.
- Data Analysis: Both tools offer features like filtering, sorting, and grouping to analyze data and identify patterns or trends.
Benefits of Power BI vs Excel:
Power BI and Excel are both powerful tools for data analysis, but each offers unique benefits. Power BI provides several advantages over Excel when it comes to advanced analytics and interactive visualizations. One of the key benefits of Power BI is its ability to handle large datasets and deliver faster performance. With its in-memory technology and optimized data models, Power BI can process and analyze massive amounts of data more efficiently than Excel. Additionally, Power BI offers a wide range of customizable and interactive visualizations, allowing users to create dynamic reports and dashboards that respond to user interactions. This enhances data exploration and makes it easier to uncover insights and trends. Power BI also excels in collaboration and sharing capabilities, enabling real-time collaboration and data refresh on the Power BI service. It provides access control, data governance, and the ability to publish reports to the web or embed them in other applications. These features make Power BI an excellent choice for teams and organizations that require centralized reporting and seamless collaboration. Overall, the benefits of Power BI over Excel lie in its scalability, performance, advanced analytics, and collaborative features, making it a preferred choice for complex data analysis and enterprise-level reporting.
Get to know about WHAT IS PROJECT MANAGEMENT IN OPERATIONS RESEARCH?
What Should You Choose Between Power BI and Excel?
Choosing between Power BI and Excel depends on your specific data analysis needs and the complexity of your data.
Choose Excel if:
- You primarily work with small to medium-sized datasets and require flexibility for ad-hoc analysis and calculations.
- Your reporting requirements are relatively simple, and basic visualizations suffice.
- Collaboration and real-time data sharing are not critical to your workflow.
Choose Power BI if:
- You handle large datasets or require advanced data modeling capabilities.
- You need interactive and dynamic visualizations for in-depth analysis and reporting.
- Collaboration, sharing, and real-time data updates are essential for your team or organization.
It’s worth noting that Power BI and Excel can complement each other. You can use Excel as a data source for Power BI or export Power BI reports to Excel for further analysis. This hybrid approach allows you to leverage the strengths of both tools.
Power BI and Excel are powerful tools for data analysis and reporting, each with its unique strengths and capabilities. Excel is a versatile spreadsheet software suitable for smaller datasets and offers flexibility in ad-hoc analysis. Power BI, on the other hand, is a dedicated business intelligence tool designed for larger datasets, advanced visualizations, and enterprise-level reporting.
Consider your specific requirements, dataset size, complexity, and collaboration needs when deciding between Power BI and Excel. Remember, they can also be used together in a hybrid approach to maximize the benefits of both tools. By understanding their differences and similarities, you can make an informed decision and choose the right tool to unlock the full potential of your data analysis endeavors.